A newly unveiled technology by Mental Health America pinpoints exactly where in the U.S. mood disorders are most prevalent
By Jason Langendorf
Mental health experts understand that a range and combination of causes, from genetics to trauma, can give rise to a mental disorder. But the field is only beginning to scratch the surface of all the drivers, interactions and key indicators associated with mental illness.
To learn more about the whys, Mental Health America (MHA), as part of its mission of prevention and recovery, has revealed a new initiative that takes a different approach to the issue: where.
“In order to respond effectively to mental health needs in our communities, we need to know who is struggling and where there is the most need.”
—Schroeder Stribling, president and CEO, Mental Health America
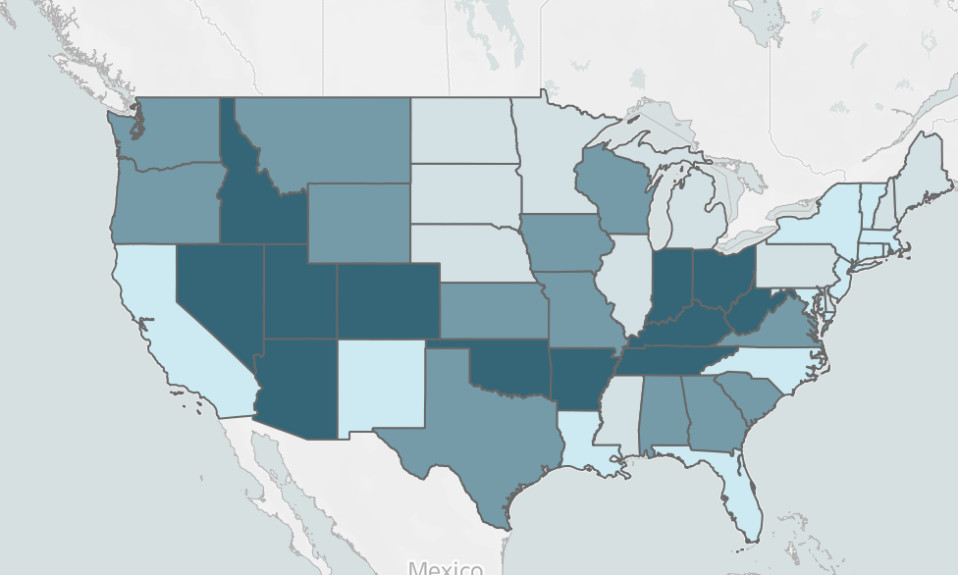
Last week MHA released a first-of-its-kind mental health mapping dashboard that provides deeper analysis, based on results from the MHA Online Screening Program, indicating where certain mental health disorders are most prevalent across the U.S., by state and county.
“In order to respond effectively to mental health needs in our communities, we need to know who is struggling and where there is the most need,” said Schroeder Stribling, president and CEO of Mental Health America. “That’s exactly what this vital project does—the dashboard identifies places where people are first starting to think they may be experiencing depression, suicidal ideation, psychosis, trauma or other conditions, and it gives communities the opportunity to intervene at the earliest stage.”
America’s Mental Health Crisis
America’s mental health is in a bad way—and the pandemic is only part of the story. The suicide rate in the U.S. increased by 33% in the two decades leading up to 2019, when it was determined that nearly one in five adults in the U.S. lived with a mental illness. And then COVID further shook our foundations.
In the many months since the pandemic began, shutdowns, job layoffs, policy battles and grave concerns over the health of our loved ones and ourselves have taken a dramatic toll: According to the Kaiser Family Foundation (KFF), about 4 in 10 adults in the U.S. have reported symptoms of anxiety or depressive disorder.
“We are battling both the public health crisis introduced by COVID-19 and a mental health crisis. If we ignore the mental health crisis happening, it will linger for decades to come.”
—Jillian Hughes, executive vice president of communications, Mental Health America
MHA has provided global online mental health screening since 2014, but it began the mapping initiative only 18 months ago. The nonprofit, which had about a million people sign up for the screening annually through 2019, saw a sudden spike in users in 2020. Hoping to learn more—and in an effort to gather timelier data—MHA launched the dashboard project. And after seeing another spike in users in 2021, says MHA executive vice president of communications Jillian Hughes, the organization knew it was on to something.
“A lot of the federal data that’s out there—like what SAMHSA releases—is on a one- or two-year delay,” Hughes says. “So it’s really hard to tell in near real time, or even in a year’s time, how people are feeling and what kind of resources folks need in their communities right now.
“That’s one of the reasons we started looking at it geographically, so that local officials in these areas could really see where the greatest need is: The SAMHSA data and federal data being released on a delay is one thing, but then county-level data is a whole other thing. There’s very little county-level data out there, period. So it’s really hard for people like local public health officials and local political officials to understand at the accounting level how folks are doing.”
The Geography of Mental Illness
Mental illness knows no boundaries, but it turns out that some areas may be more prone to mental health problems—even to specific disorders—than others.
Societal differences can create demographic schisms in terms of living conditions, treatment options and services that affect mental health. But previous analyses were mostly limited to classifications based on race and income. MHA’s dashboard breaks down its data points by state and county in hopes of flagging areas in need.
Currently, the three states with the most screened users scoring positive for respective conditions per 100,000 population are:
- Suicidal ideation: Utah, Indiana, Alaska
- Severe depression: Indiana, Utah, Tennessee
- PTSD: Arkansas, Alaska, Oklahoma
- Trauma: Oregon, Oklahoma, Indiana
- Psychosis: West Virginia, Oklahoma, Kentucky
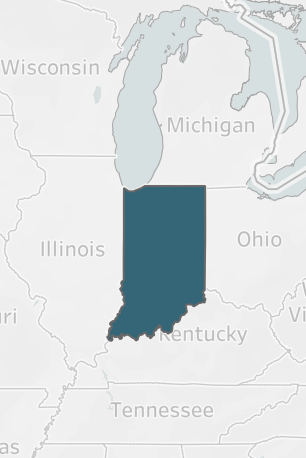
Ultimately, it will be up to local and state officials to decide what to do with the MHA data. But Hughes hopes the dashboard project will help open the eyes of community leaders “especially in some of these rural areas,” where strains on mental health among residents are most prevalent, including pockets of Kentucky and Indiana and large swaths of Alaska.
Better access to services, and more of them in general, are needed in many areas across the country. The hard data generated by the MHA dashboard initiative may be the canary in the coal mine needed to convince local leadership to take action.
“We are in the midst of a twin pandemic in 2022,” Stribling said. “We are battling both the public health crisis introduced by COVID-19 and a mental health crisis. If we ignore the mental health crisis happening, it will linger for decades to come.”